I spent most of my career before Vendrsec building backend infrastructure. Not security infrastructure specifically — distributed systems, API platforms, data pipelines. The security lens I developed came from the other side: understanding network topology not as a security construct but as a systems architecture constraint. That background shaped how we built Vendrsec's reachability engine, because it turns out the graph structures that distributed systems engineers think about naturally are exactly what vulnerability prioritization requires.
The central insight: a vulnerability's actual exploitability in any given environment is a function of whether an attacker can reach the affected asset. This sounds obvious stated plainly. The reason it isn't universally incorporated into vulnerability programs is that computing reachability at scale requires network topology data, firewall rule analysis, and graph traversal — a nontrivial engineering problem that most security teams don't have the infrastructure to solve.
What reachability means in practice
Network reachability, in the context of vulnerability prioritization, answers three questions per finding:
Direct external exposure: Can this asset be reached directly from the public internet? Does it have a publicly routable IP? Is it behind a load balancer or CDN that passes traffic through? Direct external exposure is the highest-risk reachability category — it means any threat actor with a working exploit and knowledge of the CVE can attempt exploitation without needing prior access to your network.
Lateral movement reachability: If an attacker has already compromised some other asset in your environment — through a phishing-delivered initial access vector, for instance — can they pivot from that compromised asset to reach this vulnerable one? This question requires not just knowing whether Asset B is segmented from the internet, but whether there exists a network path from any plausible initial access point (internet-facing assets, VPN endpoints, publicly accessible CI/CD systems) through intermediate hops to Asset B.
Blast radius reachability: If this asset is compromised, which other assets become reachable from it? A compromised asset isn't just a victim — it becomes a pivot point for further lateral movement. An asset that, once compromised, provides network access to 15 other internal assets (including some Tier-1 ones) carries higher prioritization weight than an isolated asset that becomes a dead end for an attacker.
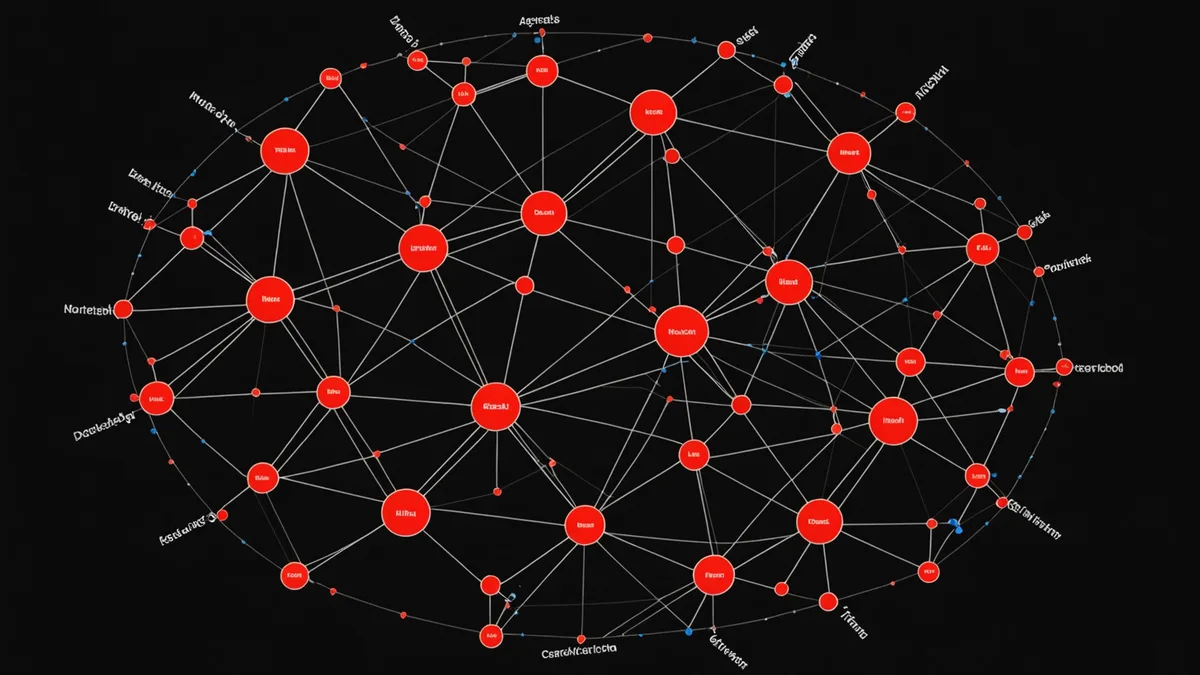
Building a network reachability graph
The data sources for a reachability graph vary by infrastructure type, but the core inputs are consistent:
Asset inventory with network identifiers: FQDNs, IP addresses, cloud resource identifiers (ARNs, resource IDs). These are the graph nodes. Your scanner already collects these as part of asset discovery — they're in the Qualys or Tenable asset records associated with every finding.
Network segmentation data: VPC configuration, subnet assignments, security group rules (AWS), firewall ACLs (on-prem), and network access control lists. These define the edges of the graph — which nodes can communicate with which other nodes, and under what conditions.
Internet exposure indicators: Load balancer configurations, CDN origin records, public IP assignments, DNS records pointing at assets. These define the entry nodes — the nodes reachable from outside your network perimeter without prior access.
Service connection data (optional but high-value): Which services call which other services — service mesh telemetry, API gateway routing rules, or manually documented service dependency maps. This adds higher-fidelity lateral movement paths beyond raw network-layer reachability.
From these inputs, the reachability graph is a directed graph where edges represent permitted network paths. Finding all paths from internet-facing entry nodes to a given internal asset is a standard graph traversal problem — breadth-first search with maximum depth limits to avoid combinatorial explosion in large environments.
Reachability in cloud environments: the IAM dimension
In cloud-native environments, network reachability alone understates the true attack surface. Cloud resources can be reached not just through network paths but through identity: a Lambda function with overly permissive IAM role can access an S3 bucket that isn't network-accessible to any external IP. A misconfigured IAM policy granting cross-account access can expose resources that appear network-isolated.
We're not saying traditional network reachability analysis is wrong for cloud — it's necessary but not sufficient. IAM-based reachability analysis, which CSPM tools like Wiz model natively, adds a second dimension to the reachability picture. When Vendrsec ingests findings from cloud-native scanners, we incorporate their IAM exposure signals alongside network topology into the reachability score.
For vulnerability findings specifically, the most common scenario where IAM reachability matters: a vulnerable dependency in a Lambda function or containerized workload. The service might have no inbound network exposure from the internet, but if it executes untrusted input from an event source (SNS message, API Gateway request, S3 event notification), an exploit path can exist through the event source rather than a direct network connection.
A concrete example: the internal service that isn't internal
Consider a hypothetical that models a pattern we've seen reconstructed in several early customer environments. A company has ~800 assets. A weekly Tenable scan returns 412 Critical and High findings. Standard triage by CVSS would produce a roughly flat list — a mix of patched-but-not-yet-remediated systems and genuinely unpatched infrastructure.
When we built the reachability graph for this environment, a specific finding jumped: CVE with CVSS 7.8 on an internal metrics aggregation service. On CVSS alone, this was mid-priority — High severity but not Critical, no KEV listing at the time. But the reachability graph revealed that this service accepted connections from the VPN gateway (as expected), and also accepted connections from a poorly scoped security group that was shared with three internet-facing application servers. The metrics service was two hops from the internet — not zero, but not isolated either.
More critically, the metrics service had read access to the application database for telemetry purposes. So the path was: internet → application server (via HTTP, no auth bypass needed, just exploit the CVE on the app server) → metrics service (via the shared security group) → database (via service account credentials accessible to the metrics service). A chain that wasn't visible from individual finding analysis but was clear from the reachability graph.
That finding moved from 23rd on the CVSS-sorted list to 2nd on the reachability-adjusted list. The vulnerability itself wasn't in CISA KEV — but the attack path it enabled was unacceptably exposed given the database access at the end of the chain.
Depth limits and graph complexity management
Full reachability analysis in large environments can produce extremely large graphs. An environment with 5,000 assets and complex network topology could theoretically enumerate millions of paths. In practice, we apply depth limits and path pruning to make the analysis tractable and useful:
Depth limit: For external reachability scoring, paths longer than 4 hops from an internet-facing entry node receive significantly diminished reachability weight. A 6-hop path is theoretically possible for a sophisticated attacker, but the coordination complexity makes it materially less likely than a 2-hop path. The weight decay is exponential with hop count, not binary.
Path relevance pruning: Not all intermediate hops are equally plausible as pivot points. An intermediate asset that requires authentication before forwarding traffic reduces the reachability score compared to an intermediate asset that relays traffic without authentication. Dead-end assets (no outbound connectivity to anything beyond their own service function) are excluded from lateral movement chains.
Delta analysis: We don't rebuild the full graph on every scan cycle. The graph increments on change events — new assets, firewall rule changes, security group modifications. This makes continuous reachability analysis practical without the full cost of graph reconstruction on every scan.
The output: reachability tiers
For Vendrsec's scoring model, reachability contributes a tier-based modifier to each finding's composite score:
- Direct external exposure: Full reachability multiplier applied — highest urgency contribution.
- 1–2 hop lateral movement path from internet-facing asset: High reachability weight — warrants elevated urgency.
- 3–4 hop path, authenticated intermediate hops: Moderate reachability weight — schedules ahead of isolated assets but below direct-exposure findings.
- No network path from internet-facing entry points or compromised-insider starting positions: Minimal reachability modifier — the vulnerability still exists and should be remediated, but urgency is substantially reduced.
Reachability doesn't replace CVSS or exploit intelligence — it multiplies them. A CVSS 9.8 with direct external exposure and active KEV listing is a five-alarm finding. The same CVSS 9.8 with zero network reachability path is an important backlog item. The difference is the reachability dimension doing its job.