Security posture thinking
Practitioner writing on CVE prioritization, CVSS contextualization, CISA KEV correlation, remediation SLA enforcement, and attack surface scoring — from engineers who ran these workflows manually before building Vendrsec to automate them.

The Vulnerability Noise Problem: Why Your Scanner Is Not Broken
Security teams treat high finding volume as a scanner accuracy problem. It isn't. Here's why prioritization, not detection, is the unsolved challenge.
CVSS 3.1 Scores Were Never Designed to Set Remediation Priority
CVSS measures exploitability and impact in isolation from your environment. Understanding what the score actually tells you — and what it deliberately leaves out.
Building an Asset Criticality Model That Reflects Business Risk
How to go from a flat asset inventory to a weighted criticality map that tells your scanner's findings where they actually matter.
Network Reachability Analysis: The Missing Variable in Vulnerability Prioritization
A CVSS 9.8 on an air-gapped dev server is not the same risk as a CVSS 7.2 on your public API gateway. Building the reachability graph that makes this systematic.

CISA KEV, NVD, and Threat Intel Feeds: What to Trust for Exploit Prioritization
Not all exploit intelligence sources are equal in timeliness, coverage, or signal-to-noise ratio. A practical guide to which feeds matter.

Alert Fatigue in Vulnerability Management Is a Prioritization Failure
When every finding is labeled Critical, nothing is. How tool over-alerting creates the conditions for the findings that matter to slip through.

What a Good Remediation Ticket Actually Contains
Most security tools hand engineers a CVE ID and a link to NVD. We looked at what information actually gets a ticket closed quickly.

Running Multiple Vulnerability Scanners? Here's How to Merge Their Output Without Going Insane
Qualys and Tenable find different things. Deduplication, normalization, and correlation strategies for multi-scanner environments.
Qualys VMDR vs Tenable.io: Integration Patterns for a Downstream Prioritization Layer
Both scanners produce different output formats, severity labels, and asset models. How to normalize their output to a unified finding schema.
CISOs and Engineers Speak Different Risk Languages. Here's the Translation Layer.
CISOs want exposure reduction in business terms. Engineers want specific fix instructions. The gap between these audiences is where programs stall.
Posture Drift: Measuring Whether Your Security Program Is Actually Making Progress
A metric for whether your remediation efforts are outpacing new finding volume — and how to build a week-over-week posture score your CISO can present to the board.
SLA Enforcement for Vulnerability Remediation: Why Most Programs Fail at the Last Mile
Setting a 30-day SLA for critical findings is easy. Enforcing it across 8 engineering teams with 2 FTEs is where the process breaks down.
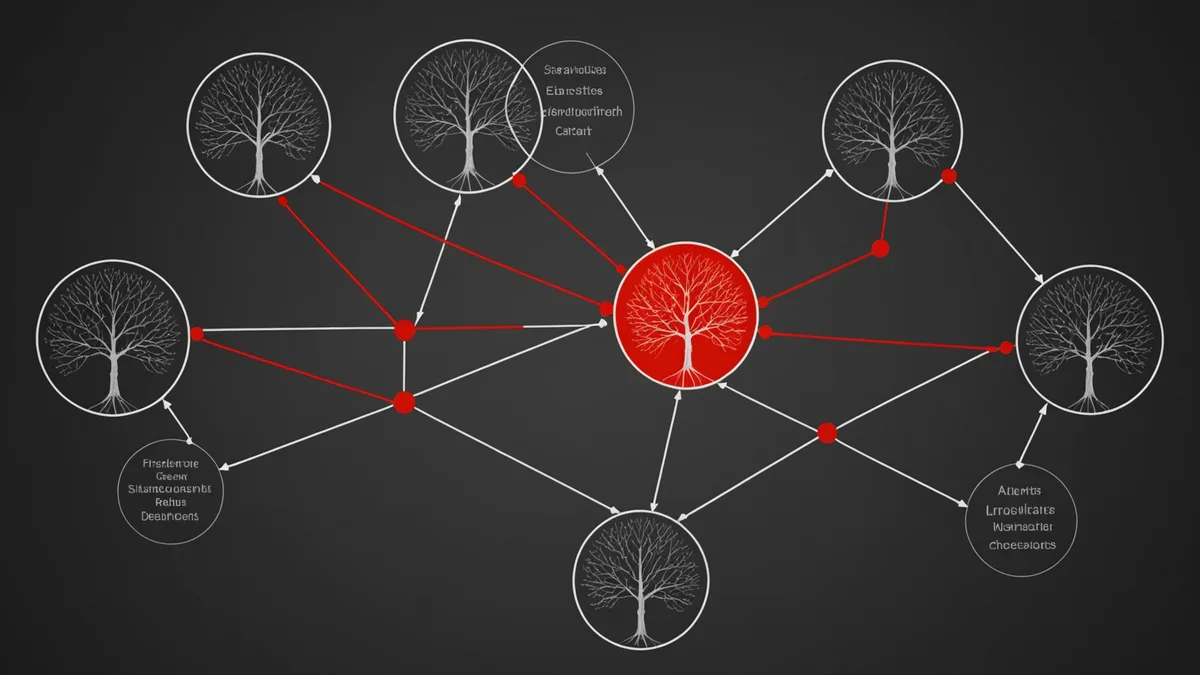
Zero-Day Triage Without a War Room: A Repeatable Process for Small Security Teams
When a critical CVE drops on a Tuesday morning, most small security teams improvise. A structured triage workflow that answers 'are we affected?' in under 20 minutes.
MTTR for Security Findings: The Metric That Exposes Whether Prioritization Is Working
Mean time to remediate is the outcome metric that reveals whether your triage process is creating clarity or just shifting the backlog.

EPSS vs CVSS for Vulnerability Prioritization: Using Both Without Double-Counting
EPSS predicts 30-day exploitation probability. CVSS measures severity in isolation. How to combine both signals without double-counting the assumptions each model already encodes.

Remediation SLAs That Engineering Teams Actually Meet
Blanket "critical = 15 days" SLAs fail because they treat all Critical findings as identical. How to tier SLAs by asset criticality and exploit likelihood — and measure adherence without gaming.

Vulnerability Management for Ephemeral Cloud Infrastructure
When containers live for hours and instances spin up from AMIs, scan-then-ticket workflows break. Why the remediation unit is the image, not the running instance.
Using SSVC Decision Trees for Vulnerability Triage
SSVC replaces numeric scores with a branching decision tree: exploitation status, exposure, and mission impact. How its logic differs from EPSS+CVSS, where it's better, and where it's worse.